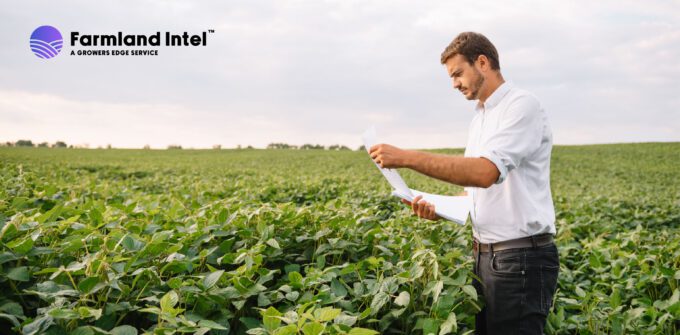
Keeping up with land values is key when you’re looking to expand your portfolio, protect assets, and build wealth. To make that easier, Grower’s Edge compiles its farmland value index each quarter, tracking where values are rising, holding steady, or declining.
Here’s a breakdown of the Q2 2025 index and what it means for farmland across America.
Illinois Farmland Values
Illinois farmland is showing signs of softening, with statewide values trending down from last year’s highs.
- Statewide farmland values slipped, down about 5.7% from the Q2 2024 peak.
- The top five counties fell 3.7% quarter over quarter, while the bottom five counties rose 5.6%.
- The highest-value counties include Morgan, Logan, Sangamon, Coles, and Douglas.
- Lowest-value counties include Cook, Williamson, Johnson, Jasper, and Lake.
Explore more Illinois farmland values
Indiana Farmland Values
On the other hand, Indiana farmland moved in the opposite direction with solid quarterly growth.
- Farmland values increased 7.1% quarterly, now 1.4% above the Q3 2024 peak.
- The top five counties rose 4.4%, the bottom five 6.2%.
- The counties with the highest value include Tippecanoe, Hancock, Hamilton, Adams, and Carroll.
- Lowest value counties include Scott, Harrison, Spencer, Brown, and Lawrence.
Explore more Indiana farmland values
Iowa Farmland Values
Iowa continued to show some of the strongest gains in the Midwest, though growth slowed down later in the quarter.
- Farmland values surged 8.3% consistently throughout quarters, though growth slowed toward quarter’s end.
- The top five counties jumped 20.2%, while the bottom five are up 9.6%.
- The highest-value counties include Lyon, Sioux, Dallas, Cherokee, and Dubuque.
- The lowest-value counties include Appanoose, Wapello, Taylor, Decatur, and Wayne.
Explore more Iowa farmland values
Minnesota Farmland Values
Minnesota didn’t experience any significant changes to farmland values this quarter, still down from its 2024 peak.
- Values remain 8.7% below Q2 2024 peak and flat compared to Q4 2024.
- The top five counties are down 4.1%, while the bottom five are down by 3.6%.
- The highest-value counties include Cottonwood, Waseca, Rock, Renville, and Watonwan.
- Lowest-value counties include Lake of the Woods, Cook, St. Louis, Koochiching, and Lake.
Explore more Minnesota farmland values
Missouri Farmland Values
Missouri farmland surged ahead in Q2, not only rebounding but pushing past its previous highs.
- Farmland values rose 15.5% year over year, 5.5% above the Q3 2024 peak.
- Bottom counties grew faster 17.8% compared to top counties at 15%.
- Highest-value counties include Atchison, St. Charles, Lincoln, Carroll, and Marion.
- Lowest-value counties include Douglas, Stone, Taney, Cedar, and Camden.
Explore Missouri farmland values
Nebraska Farmland Values
Nebraska values saw a strong quarterly increase, but they’re still struggling behind the state’s historic highs.
- Values increased 7.0% QoQ, but remain 9.4% below the Q3 2021 peak.
- The top counties grew 2.4%, while the bottom five surged 17.5%.
- The highest-value counties include Sarpy, Cass, Phelps, Douglas, and Saunders.
- The lowest-value counties include Kimball, Thomas, Hooker, Dundy, and Sioux.
Explore Nebraska farmland values
North Dakota Farmland Values
North Dakota farmland values slowed down, with values slipping further from their 2023 peak.
- Statewide values declined 2.8% QoQ and remain 15.8% below the Q2 2023 peak.
- The top five counties dipped 1.8%, while the bottom five fell by 10.0%.
- The highest-value counties include Richland, Traill, Dickey, La Moure, and Cass.
- The lowest-value counties include Rolette, Billings, Pierce, Golden Valley, and Ramsey.
Explore North Dakota farmland values
Ohio Farmland Values
Ohio farmland values ticked up slightly this quarter, though they’re still below late 2023 levels.
- Land values rose 2.8% QoQ but are still 9% below the Q4 2023 high.
- The top counties fell 16.6% QoQ, while the bottom counties held flat to slightly positive at 1%.
- The highest-value counties include Pickaway, Greene, Shelby, Morrow, and Auglaize.
- The lowest-value counties include Monroe, Jefferson, Belmont, Noble, and Harrison.
South Dakota Farmland Values
South Dakota farmland remained stable, but values remain well under their late 2022 high.
- Values held flat QoQ, but remain 17.9% below the Q4 2022 peak.
- The top five counties fell 4.8%, while the bottom five fell 9.9%.
- The highest-value counties include Lincoln, Moody, Minnehaha, Union, and Turner.
- The lowest-value counties include Custer, Harding, Ziebach, Butte, and Mellette.
Explore South Dakota farmland values
Wisconsin Farmland Values
Wisconsin farmland had one of the strongest quarters in the region, with double-digit growth.
- Farmland values increased 13.7% QoQ.
- The bottom five counties increased 39.9%, compared to 9.0% for the top five.
- The highest-value counties include Kewaunee, Calumet, Outagamie, Fond du Lac, and Dane.
- The lowest-value counties include Burnett, Douglas, Chippewa, Dunn, and Marathon.
Explore more Wisconsin farmland values
What This Means For Farmers, Landowners, and Investors
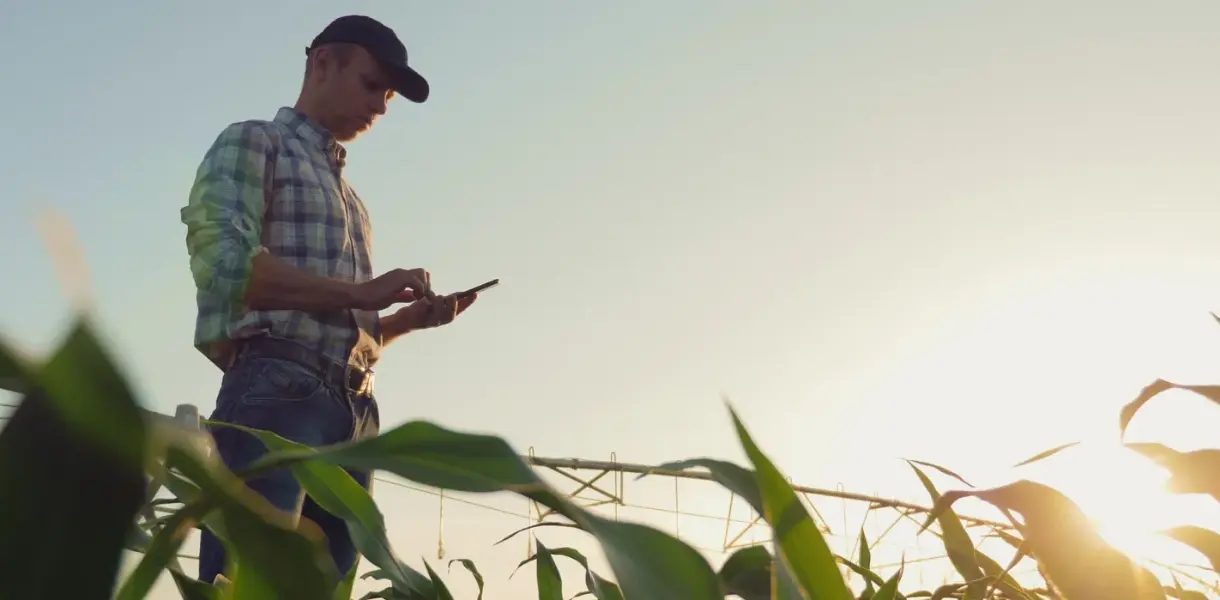
Farmland values are shaped by everything from commodity prices to interest rates to regional demand. That’s why using resources like the Growers Edge Value Index is critical, whether you’re buying, selling, investing, or simply staying on top of your land’s worth.
At Farmland Intel, we make it easy to stay informed. From the latest land values in your state to comprehensive resources like this Index, we give you the insights you need to make smarter investments.
Get updated farmland values for your state or explore our market insights to see where the land market is headed.